How to See Your Ad Performance in Meta
How to create custom column presets in Meta Ads Manager to track spend, revenue, and key funnel metrics like thumb stop rate, watch rate, clicks, and conversions for clear Facebook and Instagram ad performance analysis.

This is a complete guide to building custom reporting columns in Meta Ads Manager so you can clearly track ad performance from spend to conversion.
1. Filter for Delivered Ads
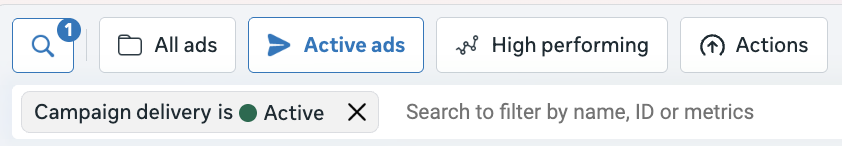
In your Meta ad account, start by making sure you are only looking at ads that have actually delivered.
Use the Ad Delivery filter in the top left to select the active date range.
2. Customize Your Columns
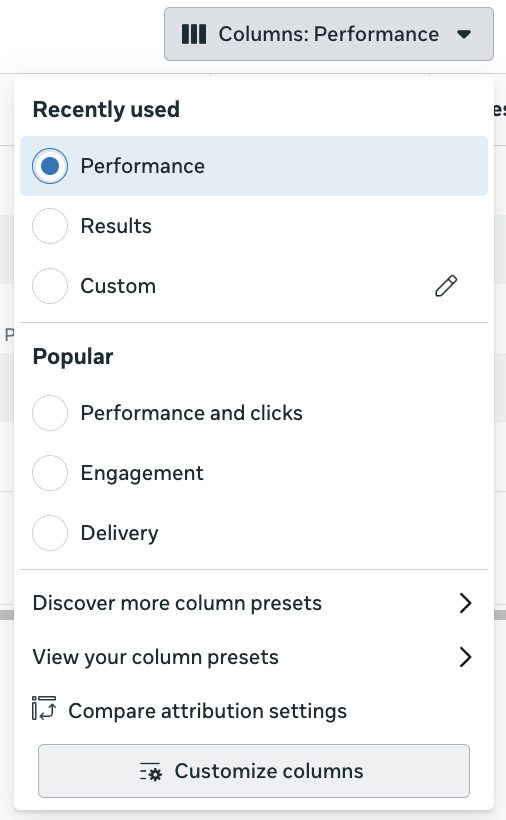
Go to Columns → Performance → Customize Columns.
Clear all existing columns and add back only what matters.
Recommended basics:
- Amount Spent – total ad spend
- Purchases – number of conversions
- Purchase Conversion Value – total revenue from those purchases
- Cost per Purchase – optional efficiency metric
- ROAS or MER/ACoS – return on ad spend or marketing efficiency
To create a custom metric like MER or ACoS:
- Click Create Metric
- Name it, set the format to percentage, and define it as Amount Spent ÷ Purchase Conversion Value.
Save this preset so you can access it any time.
3. Build a Creative Funnel
For deeper creative analysis, create a second column set to measure every key interaction in the customer journey.
Add or create metrics such as:
- Thumb Stop Rate (Hook Rate) – 3-second video plays ÷ impressions
- Watch Rate (Hold Rate) – through plays ÷ impressions
- Click-Through Rate – link clicks ÷ impressions
- Quality Click Rate – landing page views ÷ link clicks
- Product Consider Rate – product page views ÷ link clicks
- Add to Cart Rate – add to carts ÷ link clicks
- Conversion Rate – purchases ÷ link clicks
Arrange these in order from top to bottom of the funnel so you can see where people drop off.
4. Analyze Campaigns and Ads
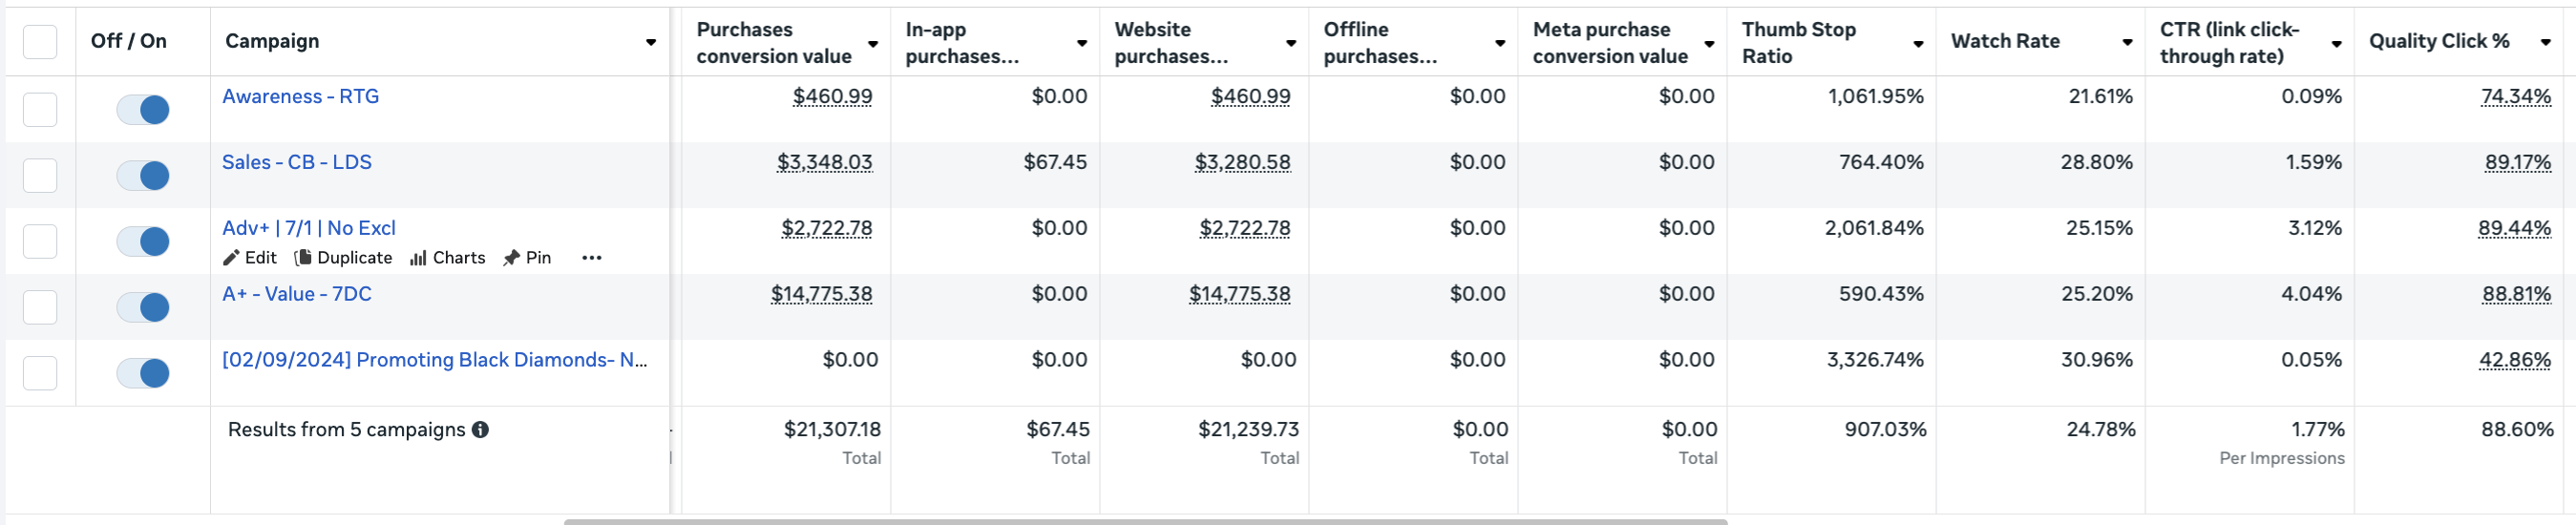
Apply your saved preset (for example, name it Creative Funnel) to see performance at the campaign, ad set, or ad level.
You can view each step of the funnel—thumb stop, watch, click, quality click, product views, add to cart, and final conversions—and identify where creative or landing pages need improvement.
By filtering for delivered ads and building custom column presets with key funnel metrics, you can clearly track spend, revenue, and every meaningful interaction to understand exactly how your Facebook and Instagram ads perform.
