How to See Ad Performance in Meta Ads Manager
Learn how to clean up your Meta Ads Manager view and track the metrics that actually matter. This quick guide walks you through customizing columns, building efficiency metrics, and analyzing the full creative funnel.

How to See Your Facebook & Instagram Ad Performance in Meta
If you’ve ever opened your Meta Ads Manager and felt overwhelmed by all the numbers, you’re not alone. Budget, reach, impressions, bid strategy… so many metrics, but which ones actually matter when you're just trying to see how your ads performed?
In this blog, I’ll walk you through the simplest, cleanest way to view your Meta ad performance, without the noise. You’ll also learn how to build performance-focused column presets, including one for conversions and another for creative analysis.
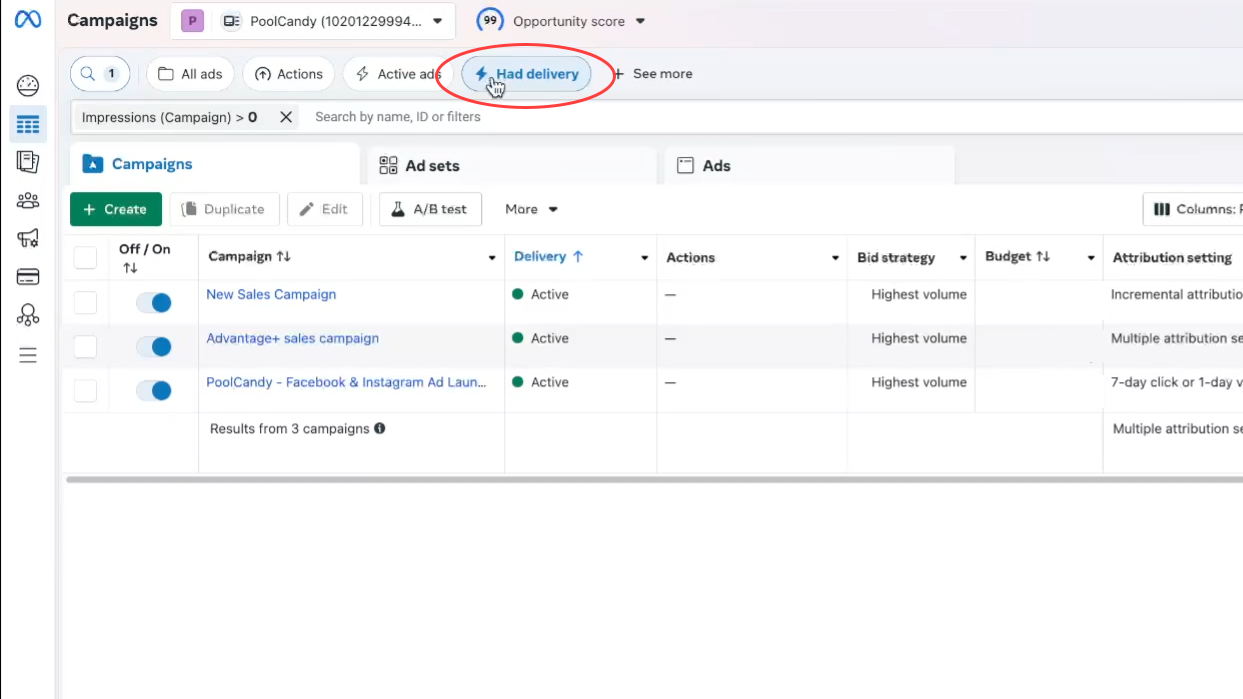
Start Here: Filter for Ads That Actually Delivered
Before you look at any metrics, make sure you’re seeing ads that delivered during your selected date range.
• Click Had Delivery
• This ensures your dashboard only shows meaningful data.
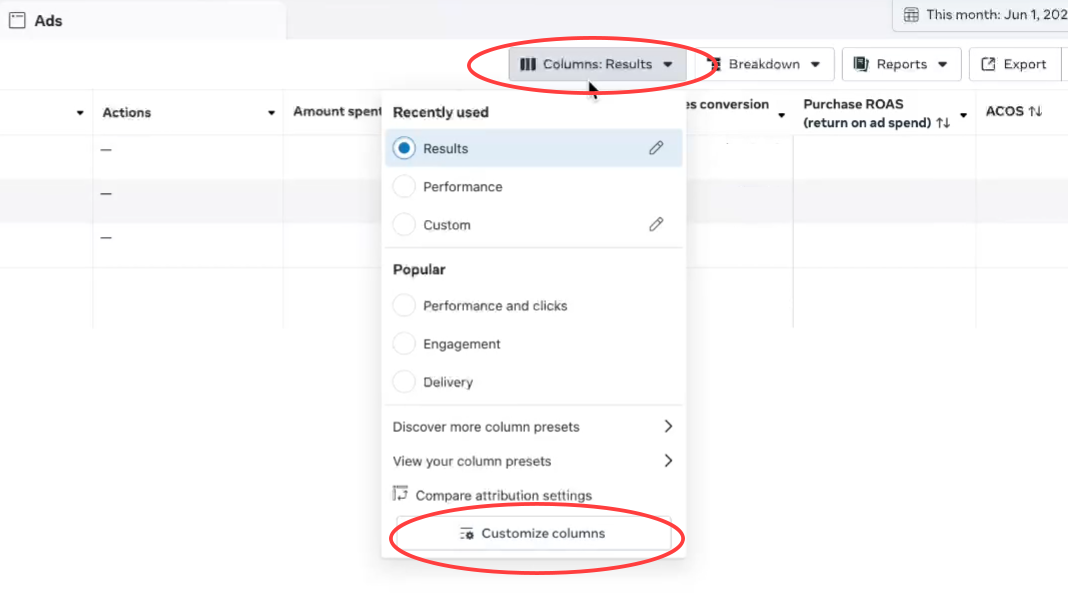
Step 1: Switch to the Right Column View
Click Columns → Performance → Customize Columns.
This is where we’ll build a cleaner, results-focused view.
Step 2: Create a “Results” Column Preset
Most accounts show way too much information by default. Let’s simplify.
Remove everything first
Click the X on all metrics in the left column.
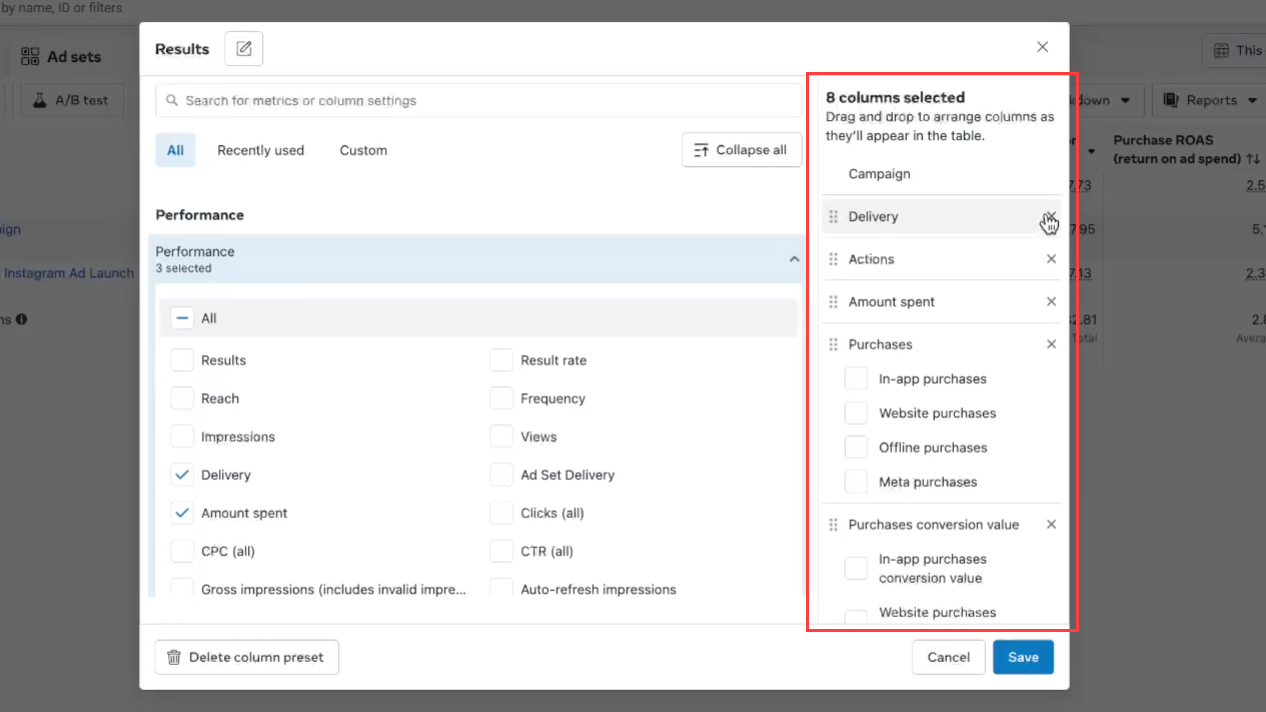
Add back only what matters
• Amount Spent (your inputs)
• Purchases (your outputs)
• Purchase Conversion Value (your revenue)
• Cost per Purchase
• ROAS
• MER / ACOS (if you're using custom efficiency metrics)
This setup lets you instantly see:
• How much you spent
• How many purchases you got
• How much revenue the campaign generated
• How efficiently each dollar worked
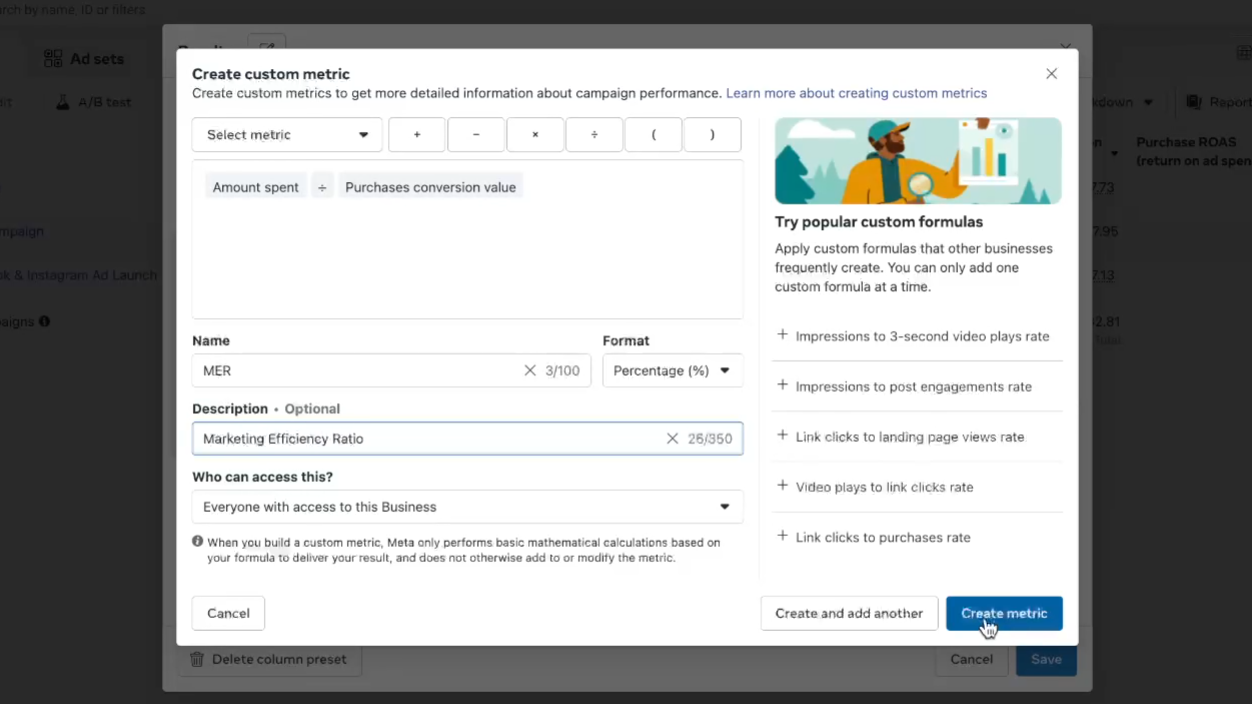
Creating a Custom Metric: MER / ACOS
If you want to measure overall efficiency (spend vs. revenue), you can create a custom metric.
Go to:
Customize Columns → Custom → Create Custom Metric
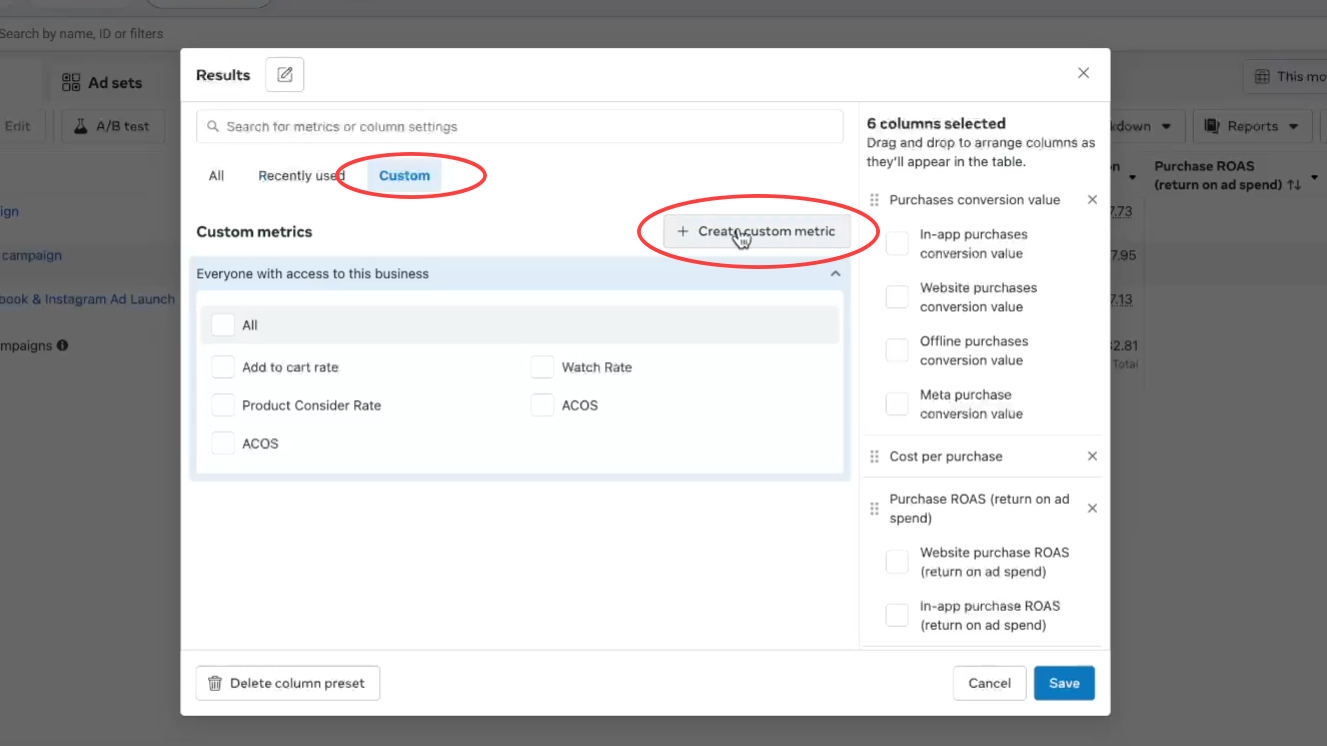
Example:
Name: MER
Set to Percentage format.
Formula: Amount Spent ÷ Purchase Conversion Value
Add a short description so your whole team understands it.
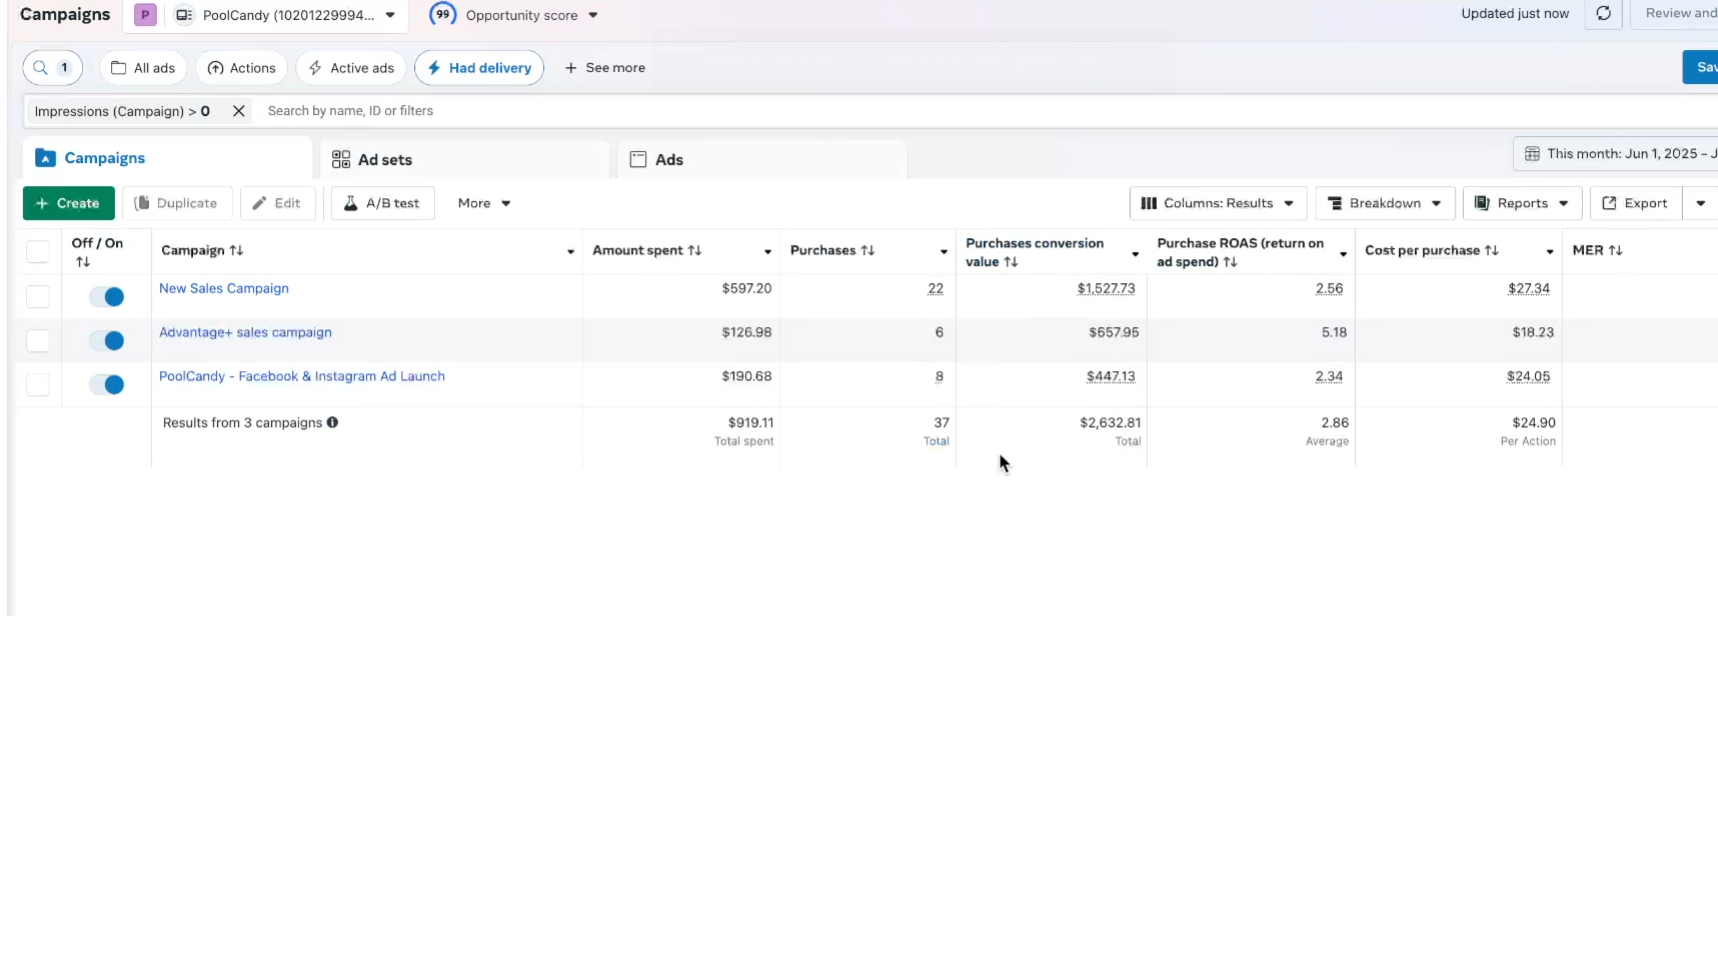
Your Results View Should Now Look Like This
• Amount Spent
• Purchases
• Purchase Conversion Value
• ROAS
• Cost per Purchase
• MER / ACOS
Simple, clean, and focused on what matters: inputs, outputs, and efficiency.
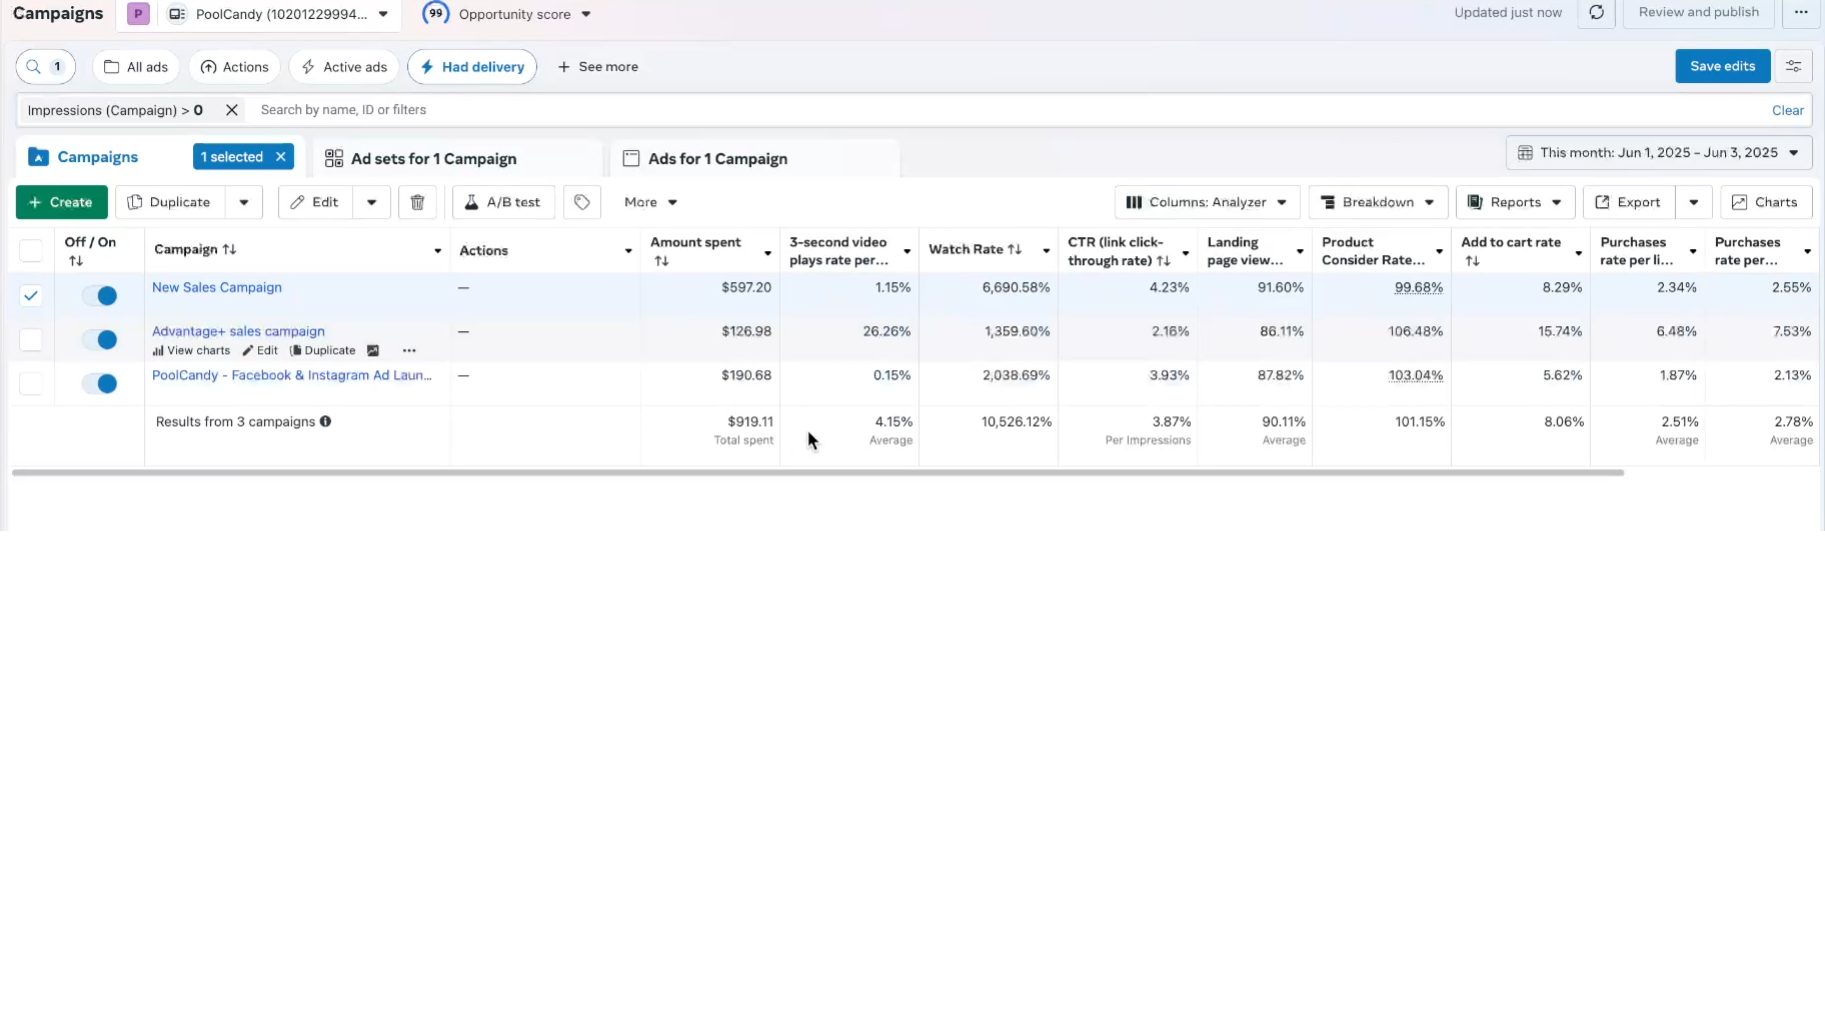
Building the Creative Funnel View (Your “Analyzer” Preset)
This second preset helps you understand how people interact with your ads—from thumb-stop to purchase.
Here’s what we’ll include, in order:
1. Amount Spent
2. 3-second Video Plays Rate Per Impressions
3. CTR (Click-Through Rate)
4. Landing Page Views per Link Clicks
5. Product Consider Rate
6. Add To Cart Rate
7. Purchase Rate Per Link Clicks
8. Purchase Rate Per Landing Page Views
Step 1: Create Your Hook Rate / Thumb-Stop Rate
Formula:
3-Second Video Plays ÷ Impressions
.png)
Step 2: Create Watch Rate / Hold Rate
Formula:
ThruPlays ÷ Impressions
.png)
Step 3: Create Quality Click Rate
Formula:
Landing Page Views ÷ Link Clicks
.png)
Step 4: Create Product Consideration Rate
Formula:
Content Views ÷ Link Clicks
.png)
Step 5: Add to Cart Rate
Formula:
Add to Carts ÷ Link Clicks
.png)
Step 6: Conversion Rate (Purchases / Link Clicks)
Formula:
Purchases ÷ Link Clicks
.png)
Step 7: Reorder Everything into a Funnel
Your final “Creative Funnel” preset should flow like this:
Thumb-Stop Rate
Watch Rate
CTR
Quality Click Rate
Product Consideration Rate
Add to Cart Rate
Conversion Rate
.png)
Final Thoughts
By building these two column presets, the Results column preset and the Creative Funnel column preset. You'll simplify your Meta Ads Manager and focus only on the metrics that matter for:
• Evaluating performance
• Understanding efficiency
• Improving creative
• Diagnosing drop-off points in the funnel
No more messy dashboards that tax your ad spend. Just clean, actionable insights.
If you need more detail and automatically generated reports, check out Lens by Foreplay.
Have any questions? Feel free to send me a message.
